
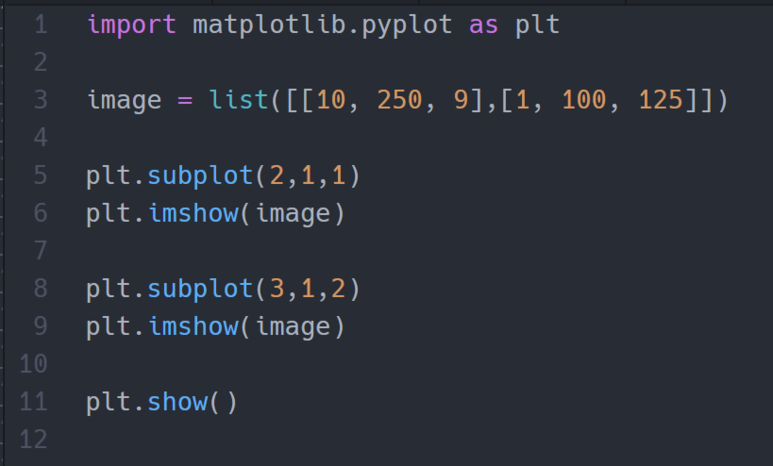
Python matplotlib.pyplot.subplot()
사용 버전: Python 3.7.6
사용 프로그램: Atom 1.45.0 x64
괄호 안에는 ncols, nrows, index, **kwargs 따위가 들어갑니다.
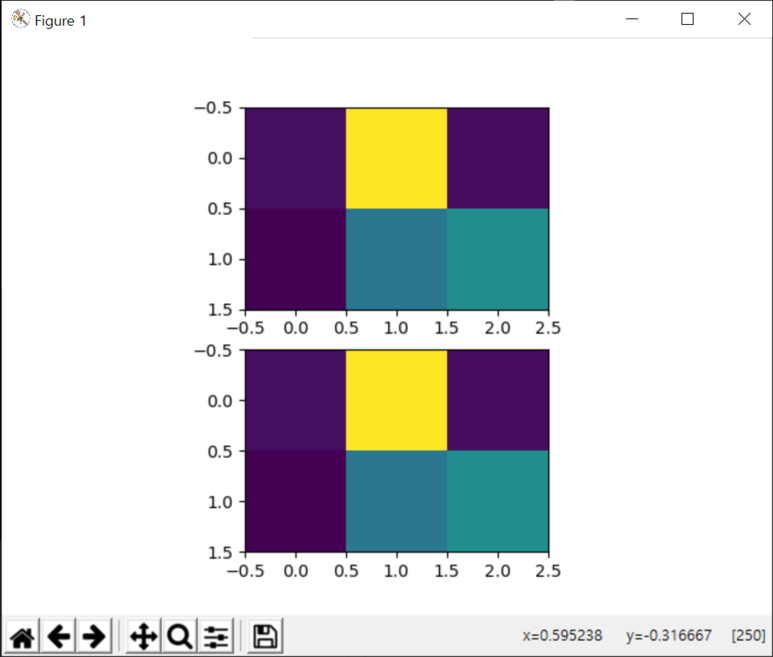
matplotlib.pyplot.subplot()은 하나의 차트 창을 분할하여 보여줍니다.
ncols에는 행의 개수, nrows는 열의 개수, index는 배열에서의 위치를 선택합니다.
끝.
사용 프로그램: Atom 1.45.0 x64
파이썬 matplotlib.pyplot.subplot()에 대해서 알아보겠습니다.
괄호 안에는 ncols, nrows, index, **kwargs 따위가 들어갑니다.
matplotlib.pyplot.subplot()은 하나의 차트 창을 분할하여 보여줍니다.
ncols에는 행의 개수, nrows는 열의 개수, index는 배열에서의 위치를 선택합니다.
끝.
카테고리: Python, Matplotlib


댓글
댓글 쓰기
궁금한 점은 댓글 달아주세요.
Comment if you have any questions.